Project Big Data
A Twitter sentiment analysis with responsive dashboard
The TwitterClient class is responsible for the API authentication and fetching the tweets.
class TwitterClient():
    def __init__(self):
        self.auth = OAuthHandler(CONSUMER_KEY, CONSUMER_SECRET)
        self.auth.set_access_token(ACCESS_TOKEN, ACCESS_TOKEN_SECRET)
        self.API = API(self.auth, wait_on_rate_limit=True)

    def get_twitter_api(self):
        return self.API

    def get_tweets(self, query, since_date="", until_date="", lang="en", exclude_retweets=True, count=10):
        tweets = []

        if exclude_retweets:
            query += '-filter:retweets'


        for tweet in Cursor(self.API.search, q=query, since=since_date, until=until_date, tweet_mode='extended').items(count):
            tweets.append(tweet)

        return tweets
The TweetAnalyzer class has a couple of uses, it:
-Cleans the Tweets using regular expressions.
-Analyses the sentiment of the Tweets using the TextBlob library.
-Stores the Tweet data in a Pandas Dataframe.
class TweetAnalyzer():
    def clean_tweet(self, tweet):
        clean_text = tweet
        #remove url, @ mentions, and punctiation
        clean_text = ' '.join(re.sub(r"(@[A-Za-z0-9]+)|([^0-9A-Za-z \t])|(\w+:\/\/\S+)", " ", tweet).split())
        #convert to lower case letters
        clean_text = clean_text.lower()
        return clean_text

    def analyse_sentiment(self, tweet):
        analysis = TextBlob(self.clean_tweet(tweet))

        if analysis.sentiment.polarity > 0:
            return 'positive'
        elif analysis.sentiment.polarity == 0:
            return 'neutral'
        else:
            return 'negative'

    def tweet_to_data_frame(self, tweets):
        df = pd.DataFrame(data=[tweet.full_text for tweet in tweets], columns=['text'])

        cleaned_texts = []
        for tweet_text in df['text']:
            cleaned_texts.append(self.clean_tweet(tweet_text))

        df['clean text'] = [text for text in cleaned_texts]
        df['sentiment'] = [self.analyse_sentiment(tweet) for tweet in df['clean text']]
        df['text_len'] = [len(tweet.full_text) for tweet in tweets]
        df['source'] = [tweet.source for tweet in tweets]
        places = [tweet.place for tweet in tweets]
        df['country'] = [None] * len(df.index)
        df['place'] = [None] * len(df.index)
        for i in range(0, len(places)):
            if places[i] != None:
                df['country'][i] = places[i].country
                df['place'][i] = places[i].name

        date_times = [tweet.created_at for tweet in tweets]
        df['date'] = [str(date_time).split('T')[0].split(' ')[0] for date_time in date_times]
        df['time'] = [str(date_time).split('T')[0].split(' ')[1].split('.')[0] for date_time in date_times]
        return df
Using the TwitterClient and TweetAnalyzer classes
Fetching tweets from the Twitter API and storing them in a dataframe.
#setup twitter classes
twitter_client = twitter_sentiment_analysis.TwitterClient()
tweet_analyzer = twitter_sentiment_analysis.TweetAnalyzer()
#get tweets from the twitter API
tweets = twitter_client.get_tweets(query='@bstategames',
since_date="2021-08-27",
until_date="2021-08-29",
exclude_retweets=True,
count=250)
#store tweets in a dataframe
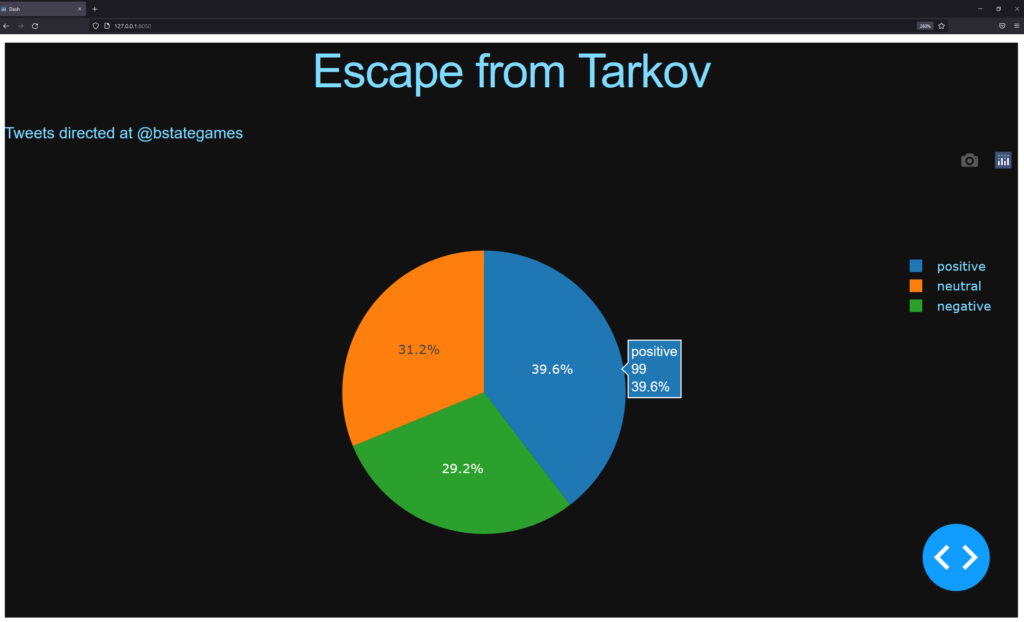
df = tweet_analyzer.tweet_to_data_frame(tweets)For the dashboard I used the Dash library. It runs a local server, creates html code from Python code and displays the fetched data from the Twitter API in a Pie Chart.
#init dash app
external_stylesheets = ['https://codepen.io/chriddyp/pen/bWLwgP.css']
app = dash.Dash(__name__, external_stylesheets=external_stylesheets)

#configure dash colors
colors = {
    'background': '#111111',
    'text': '#7FDBFF'
}

#set graph labels and data
labels = ['negative', 'neutral', 'positive']
data = [
    {
        'values': df.groupby('sentiment').size(),
        'labels': labels,
        'type': 'pie',
    },
]

#dash app layout
app.layout = html.Div(style={'backgroundColor': colors['background']}, children=[
    html.H1(
        children='Escape from Tarkov',
        style={
            'textAlign': 'center',
            'color': colors['text']
        }
    ),

    html.Div(
        children='Tweets directed at @bstategames',
        style={
            'textAllign': 'center',
            'color' : colors['text']
    }),

    dcc.Graph(
        id="pie_graph",
        figure={
            'data': data,
            'layout': {
                'plot_bgcolor': colors['background'],
                'paper_bgcolor': colors['background'],
                'font': {'color': colors['text']}
                }
        })
])